REPORTING AND DASHBOARDS
WHEN YOU NEED TO KNOW MORE—AND SHOW IT
The pressure’s on to expand the breadth, accuracy, and granularity of your financial and management reporting. Executives, investors, shareholders, auditors, and others want to know more than what’s happened—they want to know why.
And you want to surface this information quickly so your firm can correct problems or respond to opportunities before the moment is lost. Intacct Reporting and Dashboards ensures you get the deep operational and businessperformance insights that tell you why—and the real-time view that enables you to act today.
KEY BENEFITS
SEE EVERY DIMENSION OF YOUR BUSINESS
More easily create reports, graphs, dashboards, and visualizations that analyze performance by business driver. When you use dimensions to tag transactions and store financial or operational data along with its business context, you will fundamentally improve your reporting—and get fast answers to your business questions. Intacct Reporting and Dashboards includes eight built-in dimensions for capturing, and reporting on, business context. You can also create additional custom dimensions to track other business drivers.
GET THE RICH REPORTS YOU NEED— THE WAY YOU WANT THEM
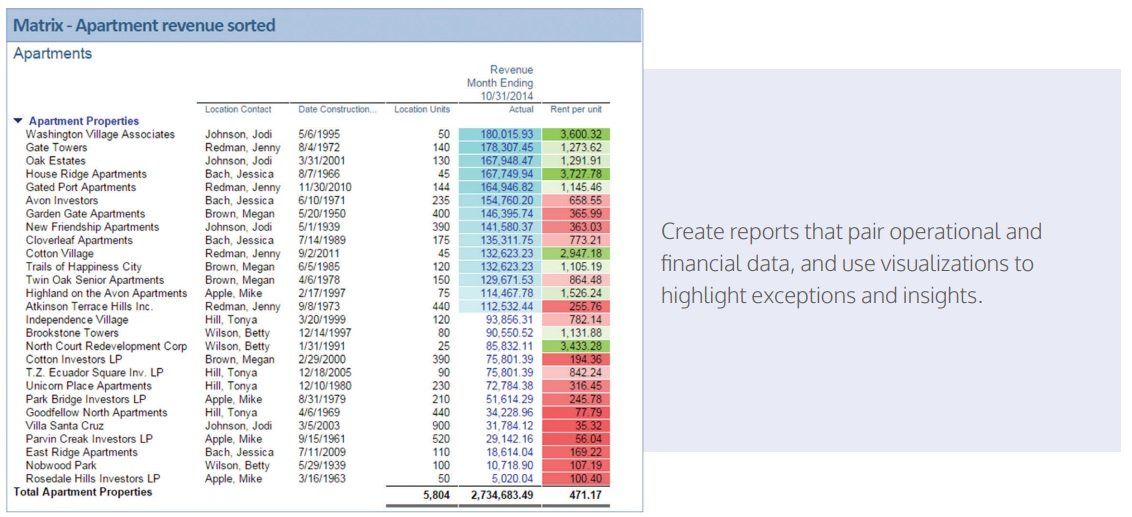
Create reports that go deeper by drawing on your combined financial and operational data. What’s more, you can drill down to source transactions for immediate, granular details, or easily view consolidated reports without waiting for period-end. With Intacct, you can do it all without exporting data to a spreadsheet, writing custom scripts, or waiting on someone to
customize reports. Take advantage of more than 150 pre-built accounting and financial reports—or build and customize your own reports right from within Intacct.
MAKE IT EASY FOR STAKEHOLDERS TO GET THE INSIGHTS THEY NEED
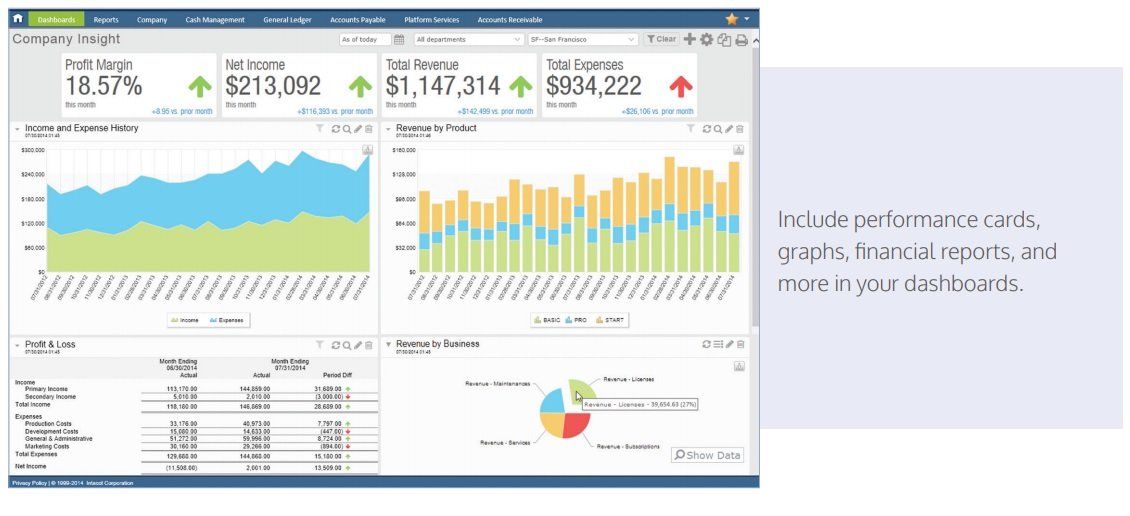
Display real-time reports, metrics, and insights tuned to the needs and perspectives of all stakeholders—in finance, sales, operations, and the boardroom—wherever and whenever they need them. Dashboards provide at-a-glance views of what matters most: cash balances, project profitability, deferred revenues, revenue per square foot—practically any ratio or metric you need. Data visualization features let you easily flag important trends, display critical comparisons, highlight missed or hit targets, and more. Skip the hassle of exporting data to a spreadsheet or presentation program and emailing it; instead, just build a dashboard once, then let Intacct update it for you in real time.
KEY FEATURES
FLEXIBLE REPORTING
Guided user interface:
Quickly lay out sophisticated reports—from scratch, from templates, or from existing reports.
Built-in financial and operational reports:
Gain greater insight into financial performance, and make better decisions, with 150 built-in reports.
Dimension-driven reporting:
Create reports using a visual user interface that enables you to quickly filter, group, and summarize your data by business driver, and quickly answer any business question.
Eight standard dimensions:
Quickly slice, dice, and summarize your data by business drivers including project, customer, location, department, vendor, item, employee, and class.
User-defined dimensions: Add user-defined dimensions for greater reporting flexibility and granularity.
Statistical accounts:
Use statistical accounts that store non-financial data and incorporate operational metrics and ratios in your financial reports.
Budget vs. actual reporting:
Incorporate budgets into financial reports to track relative performance.
Operational reporting:
Create new reports on dozens of types of records such as open invoices, missing time sheets, and customer aging.
Flexible account groups:
Combine any accounts to build account groups, and even create computational groups for advanced KPIs such as DSO and Inventory Days.
Account groups in reports:
Drag and drop account groups to build virtually any reporting layout for various GAAP and industry requirements.
Drill-down capabilities:
Drill from summary numbers to detailed figures, journal entries, and underlying transactions.
COMPREHENSIVE DASHBOARDS
Tailored content:
Build dashboards that include reports, graphs, charts, visualizations, custom lists, calendars, links, and more.
Drag and drop:
Lay out dashboard elements quickly using drag-and-drop capabilities.
Dashboard filters:
Use dimension filters to instantly view the metrics on any given dashboard—while focusing on a specific product, location, project, or other business driver.
KEY FEATURES
Mobile dashboards:
Choose a mobile version of dashboards—available on smartphones and tablets.
Date ranges:
Quickly get current or historical views into performance.
Visualizations
Report visualizations:
Quickly highlight trends and exceptions in detailed reports using conditional highlighting, trend indicators, color scaling, and spark lines.
Charts and graphs: Create charts and graphs—then publish them on dashboards or view them alone.
Performance cards:
Highlight trends in key metrics using dashboard visualizations that show actual values, period changes, and variance from budget.
USABILITY
Secure access:
Restrict dashboard access to approved users.
Automatic scheduling:
Push out scheduled reports on time, every time.
Customized formatting:
Easily set fonts, colors, and spacing for reports.
Report exports:
Save your reports in XLS, PDF, PNG, JPG, and SVG formats.


